A recent artificial intelligence simulation has generated discussion online after modeling a potential outcome for the 2028 U.S. presidential election — even though the official candidate field has not yet been finalized. The projection, which circulated widely on social media and YouTube, was created using Grok, an AI chatbot developed by a company associated with entrepreneur Elon Musk.
The simulation was prompted by a content creator who asked the system to generate a hypothetical election forecast based on assumed nominees from the Democratic and Republican parties. Using available polling data, historical voting patterns, and recent electoral trends, the AI produced a state-by-state map, estimated vote margins, and projected Electoral College totals.
It is important to note that the forecast is entirely speculative. The 2028 presidential election remains years away, and candidates have not formally declared campaigns. The AI model’s output reflects hypothetical scenarios rather than official projections.
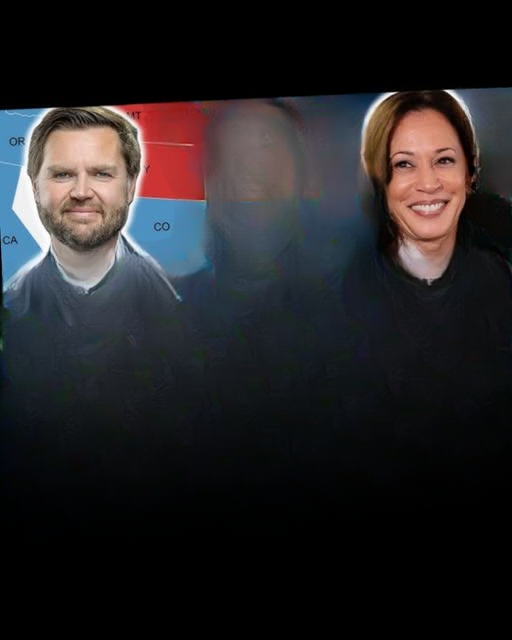
Hypothetical Matchup: Vance vs. Harris
In the simulated scenario, Vice President JD Vance was projected to win 312 electoral votes, compared to 212 for Vice President Kamala Harris. In the U.S. Electoral College system, 270 votes are required to secure the presidency.
The model assumed Harris as the Democratic nominee and Vance as the Republican nominee based on current polling trends and political positioning. While neither nomination is confirmed, both figures are frequently mentioned in early discussions about potential 2028 contenders.
The simulation categorized states into “solid,” “likely,” and “competitive” columns based on projected margins. “Solid” states were defined as those with margins exceeding 15 percentage points, while “likely” states showed projected leads between 5 and 15 points.
Early Democratic Landscape
According to recent early polling referenced in the video, Harris leads initial Democratic primary surveys with approximately 32 percent support. California Governor Gavin Newsom follows with roughly 23.8 percent, while former Transportation Secretary Pete Buttigieg polls near 10 percent. Representative Alexandria Ocasio-Cortez and Pennsylvania Governor Josh Shapiro are also mentioned as potential contenders trailing behind the top tier.
The host of the video noted that Harris’s position in early polling reflects a shift compared to reactions following the 2024 election cycle. At that time, some analysts questioned her future political prospects. However, recent data suggests she remains a significant figure within Democratic primary discussions.
Betting markets cited in the video indicate increased speculation that Harris may seek the Democratic nomination in 2028. Market probabilities reportedly rose from approximately 11 percent several months ago to 56 percent more recently. Such markets reflect public sentiment rather than official campaign decisions.
Political analysts caution that early polling numbers can shift dramatically as election cycles approach. Name recognition, fundraising capacity, and evolving political issues often reshape primary contests over time.
Republican Field Projections
On the Republican side, early polling cited in the simulation places Vice President JD Vance with roughly 49 percent support among potential primary voters. Donald Trump Jr. trails by a significant margin, while Senator Marco Rubio and Florida Governor Ron DeSantis register lower levels of support in early surveys.
The AI model estimated a 46 percent probability of Vance securing the Republican nomination, compared to an 18 percent probability for Rubio. These figures reflect hypothetical calculations based on current polling and political positioning.
As with Democratic polling, Republican primary numbers remain fluid. Historical precedent shows that early leaders do not always secure nominations, and campaign developments can significantly influence voter preferences.
Electoral Map Breakdown
In the simulation, Vance’s “solid” states included a range of traditionally Republican-leaning states across the Midwest, South, and Mountain West. These states were projected to favor the Republican nominee by margins exceeding 15 percentage points.
Among the states identified as solid Republican in the simulation were Utah, Idaho, Montana, Wyoming, North Dakota, South Dakota, Nebraska (excluding its split district), Kansas, Oklahoma, Missouri, Arkansas, Louisiana, Mississippi, Alabama, Tennessee, Kentucky, West Virginia, Indiana, South Carolina, and Ohio.
Ohio’s classification as solid Republican reflects recent voting trends. Once considered a battleground state, it has shifted more consistently toward Republican candidates in recent national elections.
For the Democratic nominee, the simulation projected solid margins in states such as Washington, California, Hawaii, Vermont, Massachusetts, Connecticut, Delaware, Maryland, the District of Columbia, and Maine’s 1st congressional district. These states have historically favored Democratic candidates in recent presidential cycles.
After tallying “solid” states alone, the AI model gave Vance a preliminary lead of 139 electoral votes to Harris’s 108.
Likely and Competitive States
The “likely” category — states projected to favor a candidate by 5 to 15 percentage points — further expanded the projected Republican advantage in the simulation.
States such as Iowa, North Carolina, Florida, Texas, Arizona, Alaska, and Maine’s 2nd congressional district were placed in the Republican “likely” column. Florida and Texas were described as firmly Republican in recent cycles, while Arizona was characterized as competitive but leaning Republican based on recent election results.
With both “solid” and “likely” states combined, the model projected Vance at 246 electoral votes, placing him 24 votes short of the 270 needed for victory. The final projected total of 312 electoral votes suggests the AI model assumed additional battleground states would ultimately tilt Republican in the hypothetical scenario.
Harris’s projected 212 electoral votes reflected a coalition similar to Democratic performance in recent presidential elections, with incremental gains in certain traditionally blue states.
How AI Election Simulations Work
AI-generated election forecasts typically rely on a combination of historical voting data, demographic trends, polling averages, and statistical modeling. These systems simulate thousands of possible outcomes based on variable inputs.
However, experts emphasize that such simulations are only as accurate as the data provided. Changes in economic conditions, international events, candidate announcements, campaign messaging, and voter turnout patterns can all significantly alter projections.
Additionally, the 2028 political landscape remains undefined. Potential candidates may enter or exit races, policy debates may shift priorities, and unforeseen developments could reshape voter sentiment.
Public Reaction and Online Engagement
The simulation gained traction on social media platforms, where political forecasts often generate discussion and debate. Supporters of various candidates shared the projection widely, while critics cautioned against interpreting speculative models as definitive predictions.
Political commentators have noted that AI tools are increasingly being used in campaign strategy analysis, voter outreach modeling, and media content creation. As these technologies become more accessible, simulated forecasts are likely to become more common in political discourse.
However, analysts stress the importance of distinguishing between official polling aggregators, professional forecasting models, and informal simulations created for content engagement.
The Road to 2028
With the next presidential election still years away, political observers expect significant changes before primary voting begins. Candidate declarations, fundraising efforts, policy platforms, and debates will shape the field more concretely over time.
Early polling and simulations can provide insight into current sentiment but should not be viewed as definitive indicators of future outcomes. Historically, presidential races have shifted dramatically in the final year before voting.
For now, the AI simulation serves as a snapshot of current political trends rather than a confirmed forecast. As the political landscape evolves, new data and developments will likely produce different projections.
The Limits of Early Forecasting
While AI-generated projections can be engaging, political scientists consistently caution against placing too much weight on early-cycle forecasts. Presidential elections are influenced by a wide range of factors, many of which are unpredictable years in advance. Economic performance, international events, legislative achievements, Supreme Court decisions, and shifts in public opinion all play substantial roles in shaping electoral outcomes.
Historically, early front-runners in both major parties have sometimes failed to secure their party’s nomination. Polling conducted several years before an election often reflects name recognition more than firm voter commitment. Candidates with national profiles tend to poll well early on, but as campaigns formally begin and voters evaluate platforms, momentum can shift significantly.
Additionally, demographic changes and migration patterns continue to alter the political landscape in key states. States once considered reliable strongholds for one party have occasionally become competitive, while others have moved more firmly into one column. Because of this fluidity, projections based heavily on past election data may not fully account for emerging trends.
Battleground States and Electoral Math
In modern presidential elections, a relatively small number of battleground states often determine the final outcome. Even when one candidate holds strong leads in traditionally aligned states, the race can hinge on competitive regions with narrow margins.
States such as Arizona, Georgia, Pennsylvania, Wisconsin, and Nevada have seen close results in recent election cycles. Small shifts in turnout or voter preference within these states can change the overall Electoral College tally.
The AI simulation discussed earlier assigned certain competitive states to one side based on current trends. However, experts note that battleground dynamics can change rapidly. Campaign investments, local issues, and candidate visits often play outsized roles in shaping results in these closely divided areas.
Because the Electoral College awards most states on a winner-take-all basis, even modest polling shifts can produce significant differences in electoral vote totals. This structure explains how national popular vote margins do not always align with Electoral College outcomes.
The Growing Role of Technology in Political Analysis
The use of artificial intelligence in political modeling reflects a broader trend in data-driven forecasting. Campaigns themselves rely heavily on data analytics to understand voter behavior, target messaging, and allocate resources efficiently.
AI tools can process enormous volumes of information — including demographic statistics, historical voting data, and survey results — at a speed far beyond traditional methods. This capability allows for rapid scenario testing, where multiple hypothetical matchups can be analyzed in minutes.
However, technology does not eliminate uncertainty. Algorithms depend on assumptions, and those assumptions may not fully capture voter motivations or future developments. For this reason, most professional forecasters emphasize probability ranges rather than definitive outcomes.
Public Engagement and Media Literacy
The widespread sharing of the simulation highlights the public’s interest in political forecasting. At the same time, it underscores the importance of media literacy. Viewers and readers are encouraged to distinguish between official election projections, independent statistical models, and speculative simulations created for discussion purposes.
Understanding how such forecasts are generated can help audiences interpret them appropriately. AI simulations can provide thought-provoking insights into current trends, but they do not replace the evolving reality of an active campaign season.
As 2028 approaches, more polling, candidate announcements, and policy debates will shape the race. Until then, projections remain snapshots of present sentiment rather than fixed predictions of future outcomes.